Mawson Neutron Monitor is situated in Mawson, Antarctica. It is a joint project among the University of Tasmania and the Australian Antarctic Division, Mahidol University, and Chiang Mai University.
Latitude: -67.60S
Longitude: 62.88E
Altitude: 0 m
Rigidity: (1965): 0.22 GV
Standard atmospheric pressure: 990.0 mb
Barometric coefficient (2004): -0.708%/mb
Cross-Counter Leader Fraction Data & Plots
READ ME
Interpret Cross Histogram Matrix
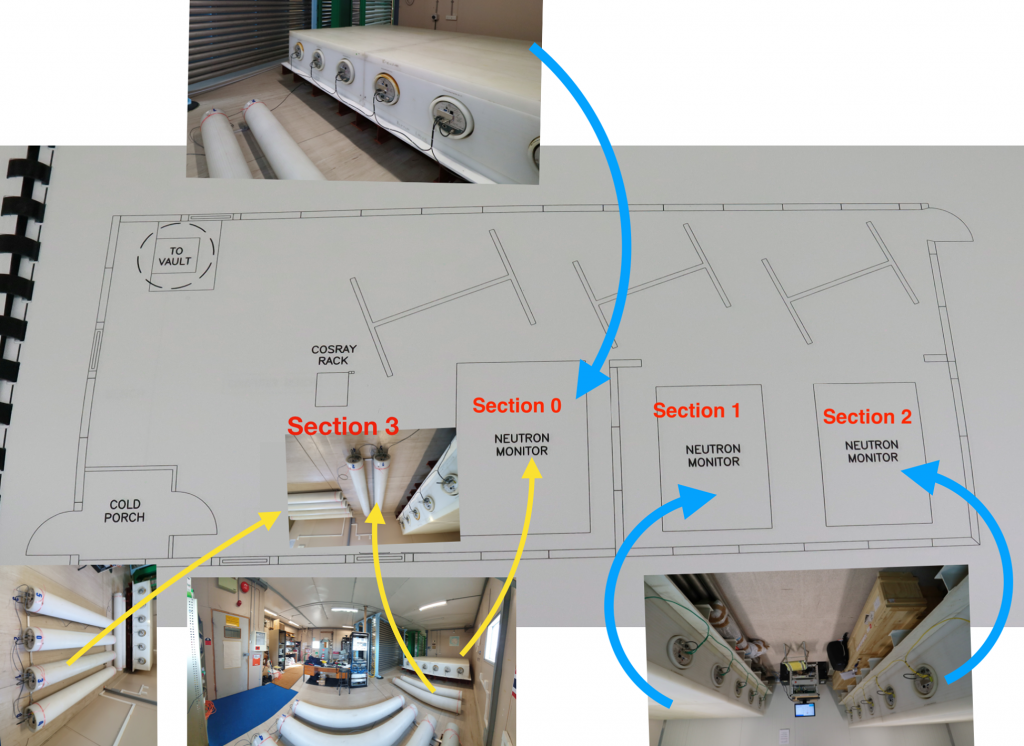
Cross-counter histograms at Mawson station collect time delays between a neutron count on one counter tube and a neutron count on another (or the same) counter tube. We indicate the first tube (row number) and second tube (column number) by “e” for end neutron monitor (NM) tubes, “m” for NM middle tubes, or “0”, “3”, or “5” for bare tubes. Bare counters 1, 2, and 4 use older electronics and do not contribute to histogram files. Note that the first 18 counters (#00 to 17) are NM counters, next 6 (#B0 to B5) are bare counters. The NM tubes are in 3 segments of 6 counters, which are physically separate. Segment 0 (counters #00 to #05) is physically close to the bares, others are on the other side of a wall. Within each segment, the neutron counter tubes are in a row with no intervening polyethylene. B5 is parallel to and closest to Segment 0. B0 and B3 are in the row of tubes perpendicular and farthest from the neutron monitor, with B0 adjacent to the wall and B3 farthest from the wall.
Mawson matrix file and annotations to explain it. The black background below shows you the matrix arrangement in a histogram file. One histogram file represents one hour.
Cross Histogram Matrix from C:\LandBase\Personality\Mawson.crm:
12 8 9 10 11 13 17 16 16 16 16 17 21 20 20 20 20 21 27 -1 -1 31 -1 35
4 0 1 2 3 7 15 14 14 14 14 15 19 18 18 18 18 19 26 -1 -1 30 -1 34
5 1 0 1 2 6 15 14 14 14 14 15 19 18 18 18 18 19 26 -1 -1 30 -1 34
6 2 1 0 1 5 15 14 14 14 14 15 19 18 18 18 18 19 26 -1 -1 30 -1 34
7 3 2 1 0 4 15 14 14 14 14 15 19 18 18 18 18 19 26 -1 -1 30 -1 34
13 11 10 9 8 12 17 16 16 16 16 17 21 20 20 20 20 21 27 -1 -1 31 -1 35
17 16 16 16 16 17 12 8 9 10 11 13 25 24 24 24 24 25 39 -1 -1 43 -1 47
15 14 14 14 14 15 4 0 1 2 3 7 23 22 22 22 22 23 38 -1 -1 42 -1 46
15 14 14 14 14 15 5 1 0 1 2 6 23 22 22 22 22 23 38 -1 -1 42 -1 46
15 14 14 14 14 15 6 2 1 0 1 5 23 22 22 22 22 23 38 -1 -1 42 -1 46
15 14 14 14 14 15 7 3 2 1 0 4 23 22 22 22 22 23 38 -1 -1 42 -1 46
17 16 16 16 16 17 13 11 10 9 8 12 25 24 24 24 24 25 39 -1 -1 43 -1 47
21 20 20 20 20 21 25 24 24 24 24 25 12 8 9 10 11 13 39 -1 -1 43 -1 47
19 18 18 18 18 19 23 22 22 22 22 23 4 0 1 2 3 7 38 -1 -1 42 -1 46
19 18 18 18 18 19 23 22 22 22 22 23 5 1 0 1 2 6 38 -1 -1 42 -1 46
19 18 18 18 18 19 23 22 22 22 22 23 6 2 1 0 1 5 38 -1 -1 42 -1 46
19 18 18 18 18 19 23 22 22 22 22 23 7 3 2 1 0 4 38 -1 -1 42 -1 46
21 20 20 20 20 21 25 24 24 24 24 25 13 11 10 9 8 12 39 -1 -1 43 -1 47
29 28 28 28 28 29 41 40 40 40 40 41 41 40 40 40 40 41 -1 -1 -1 -1 -1 -1
-1 -1 -1 -1 -1 -1 -1 -1 -1 -1 -1 -1 -1 -1 -1 -1 -1 -1 -1 -1 -1 -1 -1 -1
-1 -1 -1 -1 -1 -1 -1 -1 -1 -1 -1 -1 -1 -1 -1 -1 -1 -1 -1 -1 -1 -1 -1 -1
33 32 32 32 32 33 45 44 44 44 44 45 45 44 44 44 44 45 -1 -1 -1 -1 -1 -1
-1 -1 -1 -1 -1 -1 -1 -1 -1 -1 -1 -1 -1 -1 -1 -1 -1 -1 -1 -1 -1 -1 -1 -1
37 36 36 36 36 37 49 48 48 48 48 49 49 48 48 48 48 49 -1 -1 -1 -1 -1 -1
There are 50 leader fraction (L) combinations for the NM at Mawson.
— NM tubes in same segment —
L00: mm, same tube
L01: mm, separation 1
L02: mm, separation 2
L03: mm, separation 3
L04: me, separation 1
L05: me, separation 2
L06: me, separation 3
L07: me, separation 4
L08: em, separation 1
L09: em, separation 2
L10: em, separation 3
L11: em, separation 4
L12: ee, same tube
L13: ee, separation 5
— NM tubes in Segments 0 and 1 —
L14: mm, segments 0 & 1
L15: me, segments 0 & 1
L16: em, segments 0 & 1
L17: ee, segments 0 & 1
— NM tubes in Segments 0 and 2 —
L18: mm, segments 0 & 2
L19: me, segments 0 & 2
L20: em, segments 0 & 2
L21: ee, segments 0 & 2
— NM tubes in Segments 1 and 2 —
L22: mm, segments 1 & 2
L23: me, segments 1 & 2
L24: em, segments 1 & 2
L25: ee, segments 1 & 2
— NM tube in nearby Segment 0 and bare tube —
L26: m0, segment 0 & B0
L27: e0, segment 0 & B0
L28: 0m, B0 & segment 0
L29: 0e, B0 & segment 0
L30: m3, segment 0 & B3
L31: e3, segment 0 & B3
L32: 3m, B3 & segment 0
L33: 3e, B3 & segment 0
L34: m5, segment 0 & B5
L35: e5, segment 0 & B5
L36: 5m, B5 & segment 0
L37: 5e, B5 & segment 0
— NM tube in distant Segment 1 or 2 and bare tube —
L38: m0, segment 1-2 & B0
L39: e0, segment 1-2 & B0
L40: 0m, B0 & segment 1-2
L41: 0e, B0 & segment 1-2
L42: m3, segment 1-2 & B3
L43: e3, segment 1-2 & B3
L44: 3m, B3 & segment 1-2
L45: 3e, B3 & segment 1-2
L46: m5, segment 1-2 & B5
L47: e5, segment 1-2 & B5
L48: 5m, B5 & segment 1-2
L49: 5e, B5 & segment 1-2
When interpreting cross-counter histograms, note that the exponential tail decreases at a rate -\alpha, where \alpha is the count rate in the second tube. Therefore, if the second counter is bare, \alpha will be much lower.
If the second counter is “e”, then alpha (like the count rate) is slightly (~15%) lower than if the second counter is an “m”.